Note
Click here to download the full example code
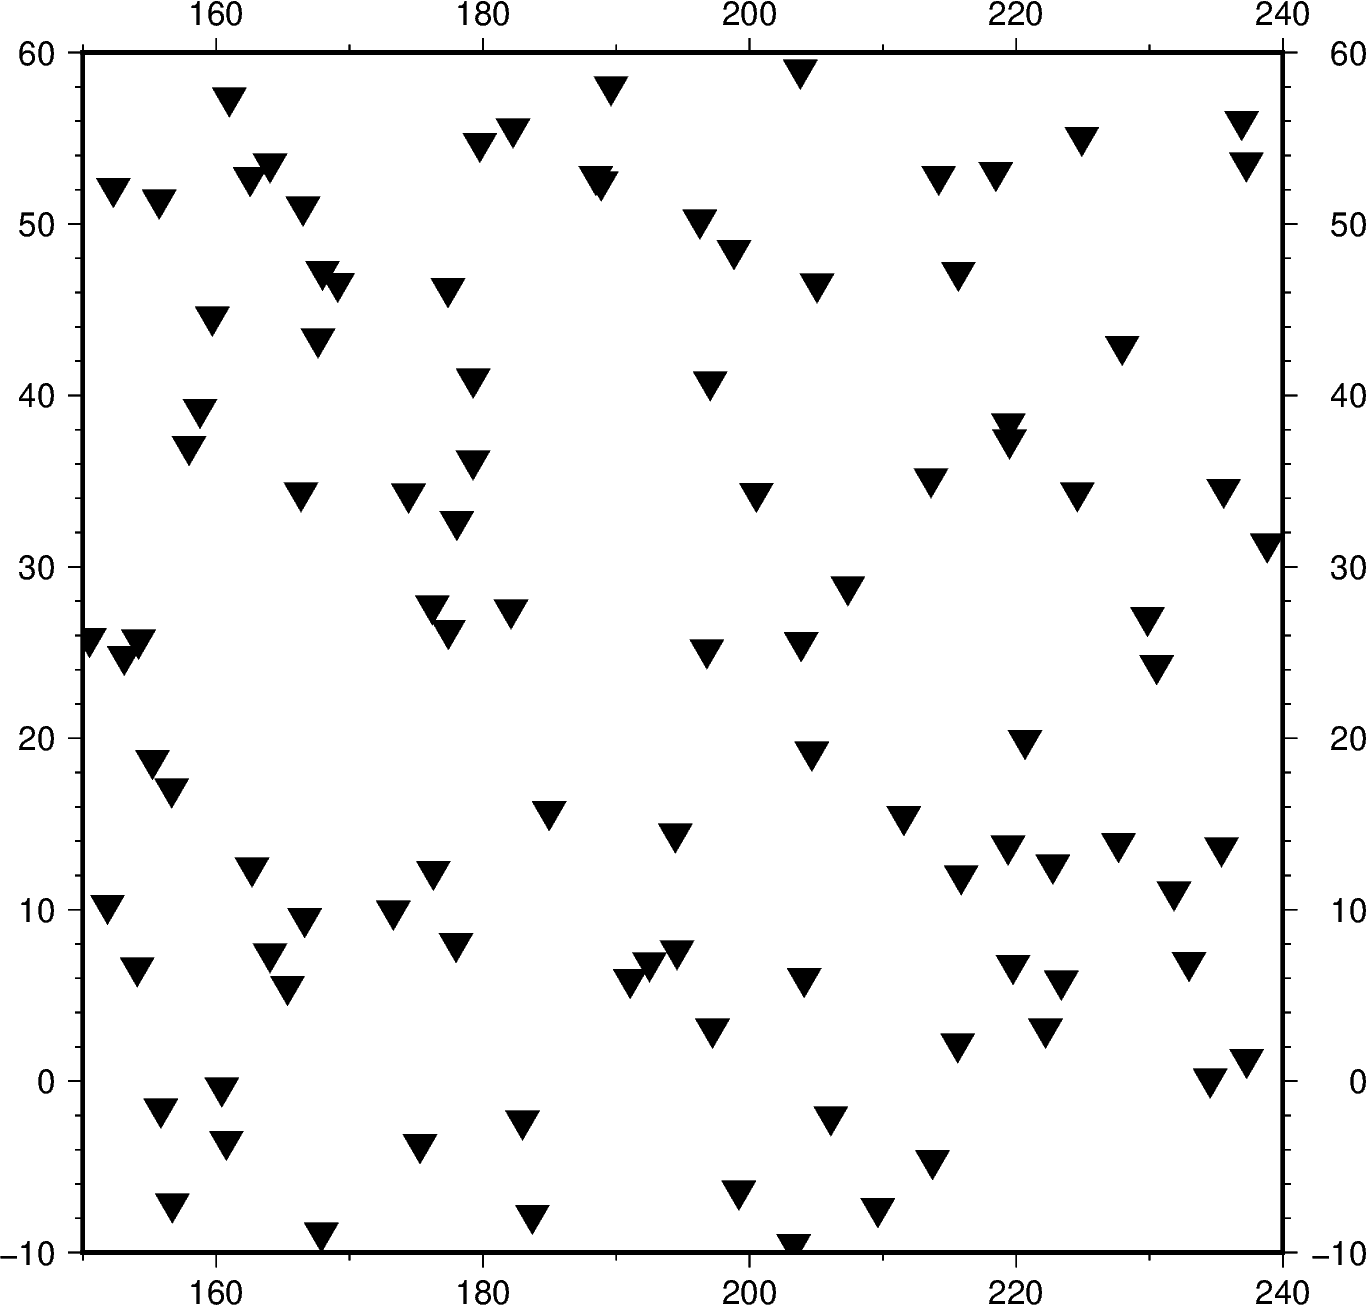
Points
The pygmt.Figure.plot method can plot points. We must specify the plot symbol
and size through the style argument.
Out:
<IPython.core.display.Image object>
import numpy as np
import pygmt

# Generate a random set of points to plot
np.random.seed(42)
region = [150, 240, -10, 60]
x = np.random.uniform(region[0], region[1], 100)
y = np.random.uniform(region[2], region[3], 100)

fig = pygmt.Figure()
# Create a 6x6 inch basemap with a Cartesian projection (X) using the data region
fig.basemap(region=region, projection="X6i", frame=True)
# Plot using triangles (i) of 0.5 cm
fig.plot(x, y, style="i0.5c", color="black")
fig.show()
Total running time of the script: ( 0 minutes 0.699 seconds)